Treasury Auctions Explained: Bid-to-Cover, Tails and Why They Matter
How a Treasury auction works, what bid-to-cover, tails and indirect bidders signal, and why recent 10-year and 30-year sales matter beyond the bond market.
NEW YORK — A Treasury auction is the moment the U.S. government finds out what investors will charge it to borrow, and after a week in which the 10-year note and 30-year bond both sold at yields not seen in more than two decades, the results have drawn attention well beyond bond desks. Understanding how a Treasury auction is run, and which numbers to read, explains why a single afternoon sale can move the dollar, gold and stock indexes.
Key takeaways
- Competitive bidders name the yield they will accept; noncompetitive bidders accept whatever yield the auction sets, and all winners receive the same rate.
- A bid-to-cover ratio compares bids with the amount offered and should be judged against recent sales of the same maturity.
- A tail, where the clearing yield is above the pre-auction market, signals weaker demand; a stop-through signals stronger demand.
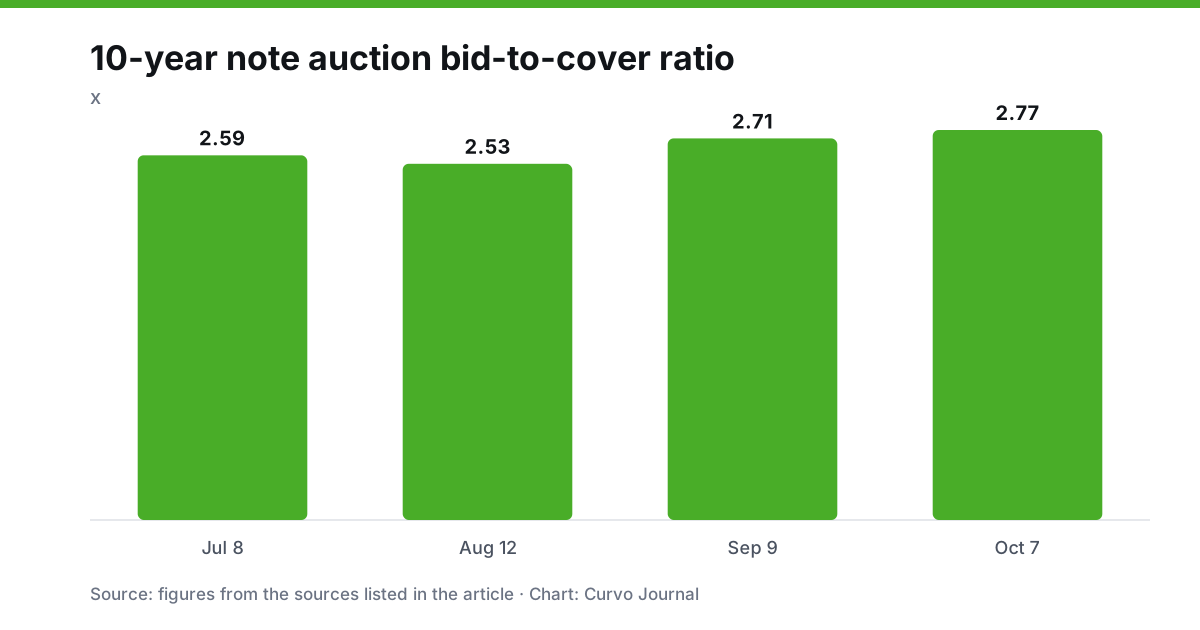
- This week’s $39 billion 10-year sale drew a bid-to-cover ratio of 2.77; the $22 billion 30-year drew 2.54.
How the auction works
Treasury announces each offering in advance and takes bids until the close, with results for coupon auctions generally published around 1:00 p.m. Eastern time. In the single-price format used for notes and bonds, competitive bidders submit the yield they will accept, and the Treasury awards securities starting with the lowest yields until the offering is filled. Everyone who is awarded securities, including noncompetitive bidders, receives the highest accepted yield.
Analyst Matthew Weller illustrates the signal with a 10-year note trading at 4.50 percent in when-issued markets. A sale that clears at 4.52 percent is a two-basis-point tail, meaning buyers needed extra yield. A clearing yield of 4.48 percent is a two-basis-point stop-through, a sign of stronger demand.
The numbers to read
The bid-to-cover ratio is the dollar value of bids divided by the amount sold. Weller’s example is $100 billion of bids for a $40 billion offering, a ratio of 2.5. A higher number generally means stronger demand, but only relative to similar auctions. TreasuryDirect data show the last four 10-year sales had ratios of 2.59 in July, 2.53 in August, 2.71 in September and 2.77 on October 7.
The split among bidders matters too. Indirect bidders, who come through primary dealers and include foreign and domestic investors, are viewed as a gauge of end-investor appetite, so a larger-than-normal share is read as positive. A high share of the offering left to primary dealers is read as weaker demand from end buyers. At the October 7 sale, indirect bidders took roughly 80 percent of the accepted competitive bids.
Why it matters beyond bonds
Higher long-term yields raise the discount rate applied to future earnings, which can weigh on growth-heavy stock indexes such as the Nasdaq 100. Rising real yields can also work against gold, which pays no interest, and a weak auction that pushes yields higher can support the dollar. Weller notes that auctions matter most when yields are moving quickly, deficits are large, inflation or term-premium concerns are rising, Fed expectations are shifting, issuance is unusually heavy or liquidity is poor. This autumn has had most of those conditions at once.
This week’s results
The $39 billion 10-year reopening on October 7 cleared at 5.300 percent. The next day, the $22 billion 30-year reopening cleared at 5.618 percent with a bid-to-cover ratio of 2.54 and indirect bidders taking about 72 percent of accepted bids. By comparison, the September 30-year reopening cleared at 5.308 percent with a ratio of 2.61.
What to watch
Weller notes that the New York Fed has documented a tendency for yields to rise ahead of auctions and partly reverse afterward. Readers following the next sales should compare the clearing yield with where the security traded before the close, check the bid-to-cover ratio against recent auctions of the same maturity, and note the indirect share. The Treasury’s quarterly refunding announcement on November 4 will set the size of the next round.
Prepared with AI assistance from public sources and reviewed under our editorial policy. Not investment advice.