How the Treasury Yield Curve Works: A Plain-English Guide
How the Treasury yield curve works: what it plots, how Treasury builds the par yield curve from market prices, and how to read its shape, slope and spreads.
The Treasury yield curve is a line that shows the interest rates the U.S. government pays to borrow for different lengths of time, from a few weeks to 30 years. Each point on the curve is the yield on a Treasury security of a particular maturity. Put together, the points show how borrowing costs change as the horizon gets longer, and traders, economists and policymakers read the resulting shape as a summary of what the market expects for interest rates, growth and inflation.
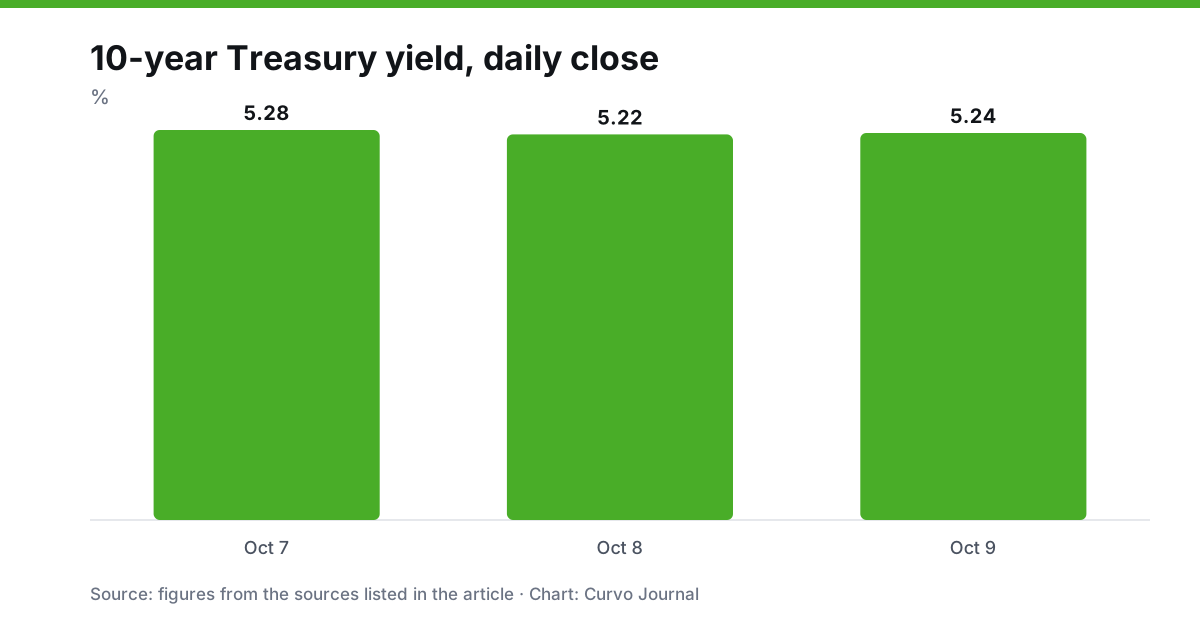
When news reports refer to Treasury yields rising or the 10-year Treasury at a certain level, they are quoting one point on this curve. Understanding the curve as a whole, and how it is constructed, makes the daily moves easier to interpret.
In brief
- The curve plots yield on the vertical axis against time to maturity on the horizontal axis.
- The U.S. Treasury publishes an official daily par yield curve, built from market prices of recently auctioned securities.
- A normal curve slopes upward; a flat or inverted curve means short-term yields are close to or above long-term yields.
- Short-term yields track the Federal Reserve’s policy rate closely, while long-term yields reflect expectations and risk compensation.
- The shape of the curve is a useful signal but not a forecast guarantee.
What the curve plots
A yield is the annual return an investor earns by holding a bond, given its price and its payments. The Treasury market issues securities in three broad groups. Treasury bills are short-term securities that mature in a year or less. Treasury notes mature in two to ten years. Treasury bonds have the longest maturities, 20 and 30 years. Each maturity has its own yield, and each yield is set by supply and demand in the market.
Plotting these yields against maturity produces the curve. Because all of these securities are backed by the U.S. government, they carry little default risk in the conventional sense, so differences across the curve mostly reflect expectations about interest rates and inflation, along with the extra return investors demand for tying up money for longer.
How Treasury builds the official curve
The Treasury Department publishes a daily set of par yield curve rates on its website. According to Treasury’s methodology page, the curve is a par yield curve derived using a monotone convex method, which replaced an earlier quasi-cubic Hermite spline method in December 2021.
The inputs are indicative bid-side price quotations for the most recently auctioned securities, collected by the Federal Reserve Bank of New York at or near 3:30 p.m. each trading day. These are quotations, not actual trades. The inputs include Treasury bills with maturities from 4 weeks to 52 weeks, notes of 2, 3, 5, 7 and 10 years, and bonds of 20 and 30 years. Bill discount rates are converted to a bond-equivalent basis so that they can be compared with notes and bonds.
Treasury then converts the prices into yields and uses them to derive forward rates at each input maturity, so that each instrument is priced without error. A monotone convex interpolation fills in the maturities between those points. The result is a set of par yields, meaning the coupon rate at which a bond of that maturity would be priced at face value. Treasury usually publishes the rates in the early evening Eastern time on trading days. Treasury reserves the right to change the inputs or the method, and the details are on its site.
This is the curve behind most of the numbers readers see. Data vendors and financial news services also quote their own real-time yields from trading screens, which can differ slightly from the end-of-day Treasury figures.
The shape of the curve
Analysts describe a curve by its shape.
Normal (upward sloping). Longer maturities yield more than shorter ones. This is the usual case when markets expect growth and a stable policy rate, and when investors want extra compensation for the uncertainty of lending for longer.
Flat. Short and long yields are close together. A flat curve often shows up when the market expects the central bank to stop raising rates, or to begin lowering them, in the coming years.
Inverted. Short-term yields are higher than long-term yields. This is a sign that the market expects policy rates to fall in the future, often because it anticipates weaker growth or lower inflation. Inversions get a great deal of attention and are covered in a separate guide on this site.
Steepening or flattening. These words describe change, not level. A curve steepens when the gap between long and short yields widens, and it flattens when the gap narrows. A bull steepener, for example, describes short-term yields falling faster than long-term yields.
What drives different parts of the curve
The short end, bills and two-year notes in particular, is closely tied to the Federal Reserve’s policy rate and to expectations about where it is heading. When investors think the Fed will raise rates, short-term yields rise, since a bill must offer a return competitive with what the policy rate is expected to be over its life.
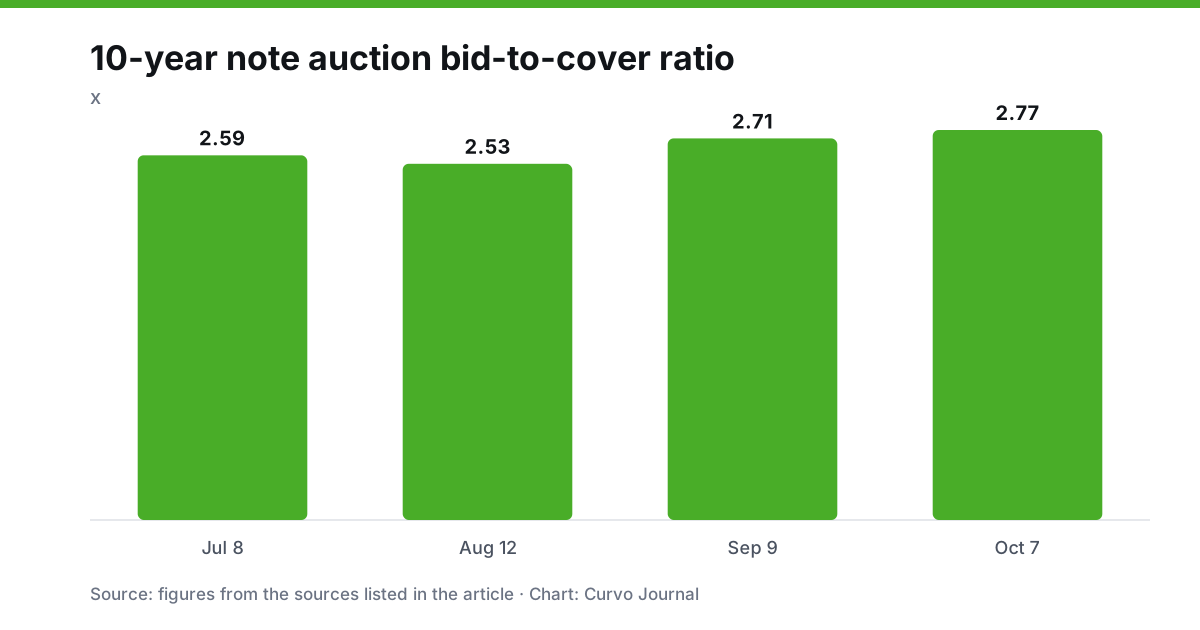
The long end reflects a mix of influences. One is the expected average path of short-term rates over the life of the bond. Another is expected inflation, since a bond’s fixed payments lose purchasing power when prices rise. A third is the term premium, the extra yield investors ask for as compensation for interest rate and inflation uncertainty over a long horizon. Supply matters too: heavy Treasury issuance and changes in demand from foreign buyers, banks, pension funds and the Fed’s own balance sheet can influence yields independent of the economic outlook. The Treasury publishes its borrowing plans, and auction results, discussed in another guide, show how demand meets supply.
Spreads and benchmarks
Market participants often use differences between points on the curve. The spread between the 10-year and 2-year yields and the spread between the 10-year and 3-month yields are commonly cited. They compress the curve into one number that is positive when the curve slopes up and negative when it inverts. The Federal Reserve Bank of New York publishes a model that uses the slope of the curve, which it calls the term spread, to estimate the probability of a U.S. recession twelve months ahead. The New York Fed’s documentation explains the specification and the data.
The 10-year Treasury yield is a benchmark for much of the financial system. Mortgage rates, corporate borrowing costs and valuations of other assets are often compared with it. That does not mean the 10-year yield sets those rates directly, but the relationships are close enough that moves in the 10-year are widely watched.
What the curve can and cannot tell you
The curve compresses a great deal of information, but it is not a crystal ball. A few cautions apply.
First, the curve reflects market prices, and markets can be wrong. An inverted curve has often preceded recessions, but the lag has varied and the relationship is not mechanical. Second, factors other than expectations affect the curve. Large-scale central bank purchases, regulatory demand for safe assets and global capital flows can push long yields down, making the curve flatter than expectations alone would justify. Third, the curve is a statement about government borrowing rates, not about the borrowing costs for households or companies, which include credit spreads on top.
A worked example
Suppose the curve on a given day shows these par yields: 3 months at 4.0 percent, 2 years at 4.2 percent, 10 years at 4.5 percent and 30 years at 4.7 percent. These numbers are illustrative only. The curve slopes upward, and the 10-year to 2-year spread is 0.3 percentage points, or 30 basis points. A basis point is one hundredth of a percentage point.
Now suppose the market comes to believe that the Fed will cut rates. Two-year yields might fall to 3.8 percent while 10-year yields fall only to 4.4 percent. The spread widens to 60 basis points, and the curve steepens, even though all yields have declined. If instead investors expected the Fed to raise rates and hold them high, the 3-month and 2-year yields could rise above the 10-year, and the curve would invert.
Where to find the data
The Treasury publishes daily par yield curve rates, bill rates, real yield curve rates and long-term rate data in the Data and Charts Center of home.treasury.gov. The Federal Reserve Board also publishes Treasury yields in its H.15 statistical release on federalreserve.gov, and the Federal Reserve Bank of St. Louis’ FRED database provides historical series that can be charted. For terms and definitions, the SEC’s Investor.gov explains basic features of bonds, including the inverse relationship between prices and interest rates.
FAQ
What is the yield curve in simple terms?
It is a chart of Treasury yields by maturity. It shows how much the government pays to borrow for a few weeks, a few years or several decades.
Who publishes the official Treasury yield curve?
The U.S. Department of the Treasury publishes the daily par yield curve rates, using prices collected by the Federal Reserve Bank of New York.
Why is the 10-year Treasury so closely watched?
It is a widely used benchmark for long-term borrowing costs and for investors’ expectations about growth and inflation. Many other interest rates are priced in relation to it.
What does a steeper curve mean?
It means the gap between long-term and short-term yields has widened. This can reflect expectations of stronger growth or higher inflation, or expectations that short-term rates will fall.
Is the yield curve the same as the Fed’s interest rate?
No. The Fed sets a target range for its policy rate, which anchors short-term yields. The rest of the curve is set by the market.
Is a Treasury yield the same as an interest rate on a savings account?
No. A Treasury yield is the return on a tradable security whose price changes. A savings rate is set by the bank. The two often move in the same direction, but they are different instruments.
Prepared with AI assistance from public sources and reviewed under our editorial policy. Not investment advice.